
Effect sizes vs. p-values: what are they, and what do they mean?
We will answer the questions:
-
What is an effect size?
-
How do effect sizes and p-values relate to hypothesis testing?
-
Which is more important?
-
What are common confusions associated with reporting p-values and effect sizes?
What is an effect size?
The null hypothesis is always constructed to predict that there will be ‘no effect’ in the data.
That is, the null hypothesis requires an ‘effect size’ of zero.
What does it mean to have, vs not have, an effect in the data?
-
This will depend on the context of the experiment
-
The most common examples are experiments measuring:
-
the mean of a dataset (Fig. 1a)
-
testing the null hypothesis that predicts a mean difference of zero
-
-
a trend in data (Fig. 1b)
-
testing the null hypothesis that predicts a correlation of zero
-
-
How do effect sizes and p-values relate to hypothesis testing?
Let’s imagine an incredibly simple ‘experiment’, designed to test whether body temperature is above or below normal (98.6˚F).
-
If you are handed a new thermometer and take a single thermometer reading, you have some idea of whether temperature is ‘within the normal range’
-
Taking multiple readings gives you a more reliable measurement, because you can identify:
- whether that first reading was an anomaly
- whether multiple readings are extremely similar
- e.g., all readings are within a small fraction of a degree
- whether multiple readings are quite variable
-
e.g., consecutive readings vary by several degrees
-
-
This temperature example is a case where we are comparing your measurement of body temperature, based on multiple readings, to a known standard
-
usually accomplished via t-test.
-
-
The t-test compares the difference between the average of the thermometer observations and a standard 98.6˚ body temperature, divided by the standard error of the mean:
-
The t-value increases when:
-
the the average of data values [ ] moves further from the standard value [ ]
-
- i.e., when the absolute value of the difference increases
And when the standard error of the mean, , decreases:
- Either because observations are less variable [ is small]
- Or there are more observations [n is large]
Of the three factors that affect your t-value, two are intrinsic to the data:
-
is simply the actual difference between your data mean and the reference value
-
is the intrinsic level of noise in the data
These two factors are combined to define the effect size related to the t-test:
This measure of effect size is called Cohen’s d.
-
It defines a signal-to-noise ratio
-
i.e, it tells you the size of the signal you are interested in detecting, , relative to the noise, , in the data.
-
Cohen’s d gives the size of an effect in -units.
If your effect is more than about .8 -units, it is considered a large effect.
However, for any non-zero effect size you can name, I can find a number of experimental observations that will make that effect statistically significant (i.e., yield p < 0.05):
-
For example, the above-mentioned cutoff for a 'large' Cohen’s d, , requires almost 10 observations to produce a significant t-test
-
On the other hand, a Cohen’s d of requires about 600 observations to become statistically significant
While effect size is meant to tell you if the signal you are attempting to quantify is large enough to notice, over and above the level of intrinsic noise in the data, the p-value is primarily about the reliability of the effect
i.e., whether the observed mean is reliably different from the reference value
These two concepts, signal-to-noise ratio and reliability, are definitely related, but not identical
-
It is easiest to detect a reliable difference in a t-test if there is a large signal,
-
On the other hand, the reliability of your measurement improves when:
-
you have intrinsically reliable data
-
[ is small]
-
-
and/or when you have lots of data
-
[n is large]
-
-
This final factor, the size of the dataset (n), is the only factor over which we generally have any control, and so it is the focus of much of the discussion you will find regarding p-values.
For example, when we increase the size of the dataset, the true difference between the to-be-measured body (x) temperature and reference value (µ) doesn’t change.
-
Although the true difference doesn't change, it is nevertheless true that the sampling distribution of the mean difference becomes narrower for larger datasets (Fig. 2).
-
This means that the probability of observing any given difference, , between the data mean and reference value decreases.
-
Interestingly, there is really always the potential for a statistically significant effect in the data, in the following sense:
-
Suppose the true value of the to-be-measured body temperature is actually zero.
-
In this case, the true effect is also zero.
-
-
However, the mean, even of a very large dataset, will not be exactly equal to the true value.
-
So the data will indicate that there is an effect
-
-
This small effect, if the dataset is large, can yield a small ('significant') p-value.
In this scenario, your conclusion must indicate a statistically significant hypothesis test that in turn causes you to reject the null hypothesis (i.e., reject the hypothesis that there is no effect).
This is the danger of large datasets, and one of the reasons effect sizes are currently in vogue as a way to shore up the logical inconsistencies of p-values and statistical null hypothesis testing.
Which is more important?
Our goal in analyzing data is usually to test hypotheses.
-
in the neural and behavioral sciences, this can often take the form of looking for differences between control and patient groups
-
If you simply want to know if there is any difference between the groups, then you are more interested in p-values, and do not care if the difference between groups is large
-
If you want to know if there is a clinically relevant difference between groups that results from your treatment, then you want to see that there is a statistically significant hypothesis test, and also that the effect size is large enough that patients will actually notice the difference produced by your treatment
-
In this second case, one or the other alone is not enough.
-
if you have a large effect but it is unreliable (e.g., one patient in your study showed an extremely large improvement, but none of the others did - so the effect is still large), this is not convincing evidence that your treatment works at all (not statistically significant)
-
if you have a small p-value but also very small effect (e.g., you needed to enroll thousands of patients and controls in your study to find a statistically significant effect) then your treatment may help, but no one will notice the improvement.
-
An example would be a drug that reliably shortens the common cold by half an hour. An improvement, to be sure, but not one that any given individual taking the drug would recognize had occurred
-
What are common confusions associated with reporting p-values and effect sizes?
Confusion can easily arise when reporting p-values and effect sizes because these two computations are based on different assumptions
-
you should understand the assumptions made when you compute p-values and effect sizes
To think about these issues, ask yourself whether the assumptions made when you compute p-values are consistent with the assumptions made when you compute effect sizes
It turns out that the two calculations are based on quite conflicting assumptions
-
The p-value calculation is based on assuming the truth of the null hypothesis
-
that is, assuming that there is no effect present in the world
-
effect = 0
-
-
-
The effect size calculation is based on assuming that some alternative hypothesis is true
-
that is, assuming that there is a nonzero effect
-
effect > 0
-
-
If you have finished an experiment and reject the null hypothesis, it seems to make sense to also report an effect size:
-
In this situation, you are saying that you reject the null hypothesis that there is no effect
-
that if the effect had been zero, your observed data are very unlikely
-
and you further believe the effect present (i.e., your measurement of the effect size) has a particular value (e.g, that Cohen’s d = 0.85)
-
Interestingly, once you reject the null hypothesis and report a nonzero effect, you have violated the assumptions of the calculations made for the null hypothesis test (that the effect size is zero).
-
To explore this idea further, consider the common practice of computing both measures before you collect data, when you are proposing a new experiment
-
as part of such proposals, you are often asked to 'perform a power analysis' or (equivalently) make 'effect size' or 'sample size' calculations
-
these calculations are intended to indicate how many experimental observations (n) you will need, such that you would produce a statistically significant result when the effect size is known (and nonzero)
-
-
However, by proposing to perform an hypothesis test, you assume an effect size of zero (this assumption underlies all your computations when performing statistical hypothesis tests)
-
At the same time, you are proposing that there is likely a nonzero effect of a very specific size.
-
This assumption is required to invert the t-test and make effect size calculations
-
-
-
-
These conflicting assumptions are problematic within classical statistics because the definition of probability forbids this situation
-
probabilities can only be defined in terms of real-world frequencies, and not based on thought experiments (this is why probabilities defined this way are called 'objective')
-
therefore if real-world data frequencies match the null hypothesis, it is not valid to talk about probabilities based on nonzero effect sizes
-
contrariwise, if real-world data frequencies match a nonzero effect, it is not valid to define or compute probabilities consistent with a null-hypothesis test
-
-
probabilities defined in terms of information (or thought experiments) are only valid within the Bayesian interpretation of probability
-
-
-
The most recent wrinkle on this topic is the call for adding error bars to reports of effect sizes
-
however, interpreting error bars as bounds on the potential true values of the underlying effect is a misunderstanding of the definition of the error bar
-
error bars tell you about potential observed datasets, given that the true value of the effect is known
-
the reverse is not true: they do not tell you about the most likely values of the true effect, given that the data are known - this type of error bar is only definable within the Bayesian interpretation of probability.
-
-
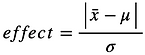


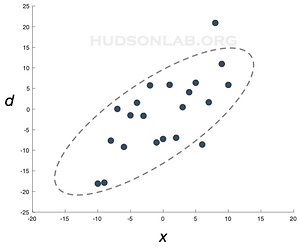
Fig. 1a
Fig. 1b
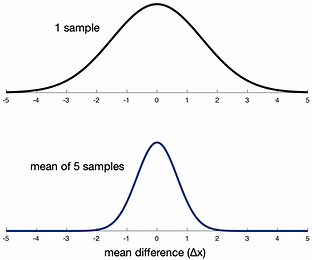
Fig. 2